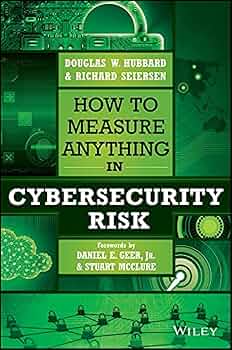
The books already exist. Hubbard and Seiersen explain why you can measure cyber risk,
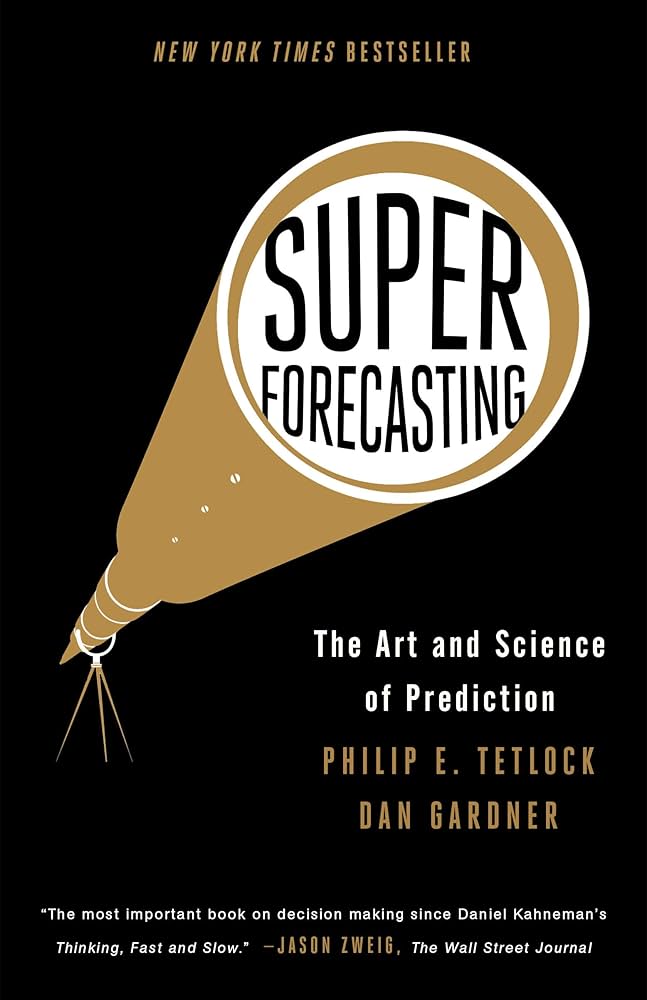
Tetlock explains why some people forecast well, Freund and Jones give you FAIR,
Martin-Vegue walks you from heat maps to histograms, and Rick wrote the first principle
down. Read all five and you still won't have a curve.
This workshop is the missing chapter. We teach four techniques, then make you use them
on a company whose board meets in 45 minutes.
Bayesian Updating
A cue ball hides somewhere on a billiards table. Every ball you roll after it
tells you a little more about where. That's Bayes. It's also what a threat-intel
alert should do to your estimate of whether you're compromised: move it by a
measurable amount.
Fermi Estimation
What does ransomware recovery cost a 5-hospital system in a year? Nobody knows.
Break it into parts you can guess at, multiply them, and land within an order of
magnitude or two of the truth.
Structured Forecasting
Your gut has a number for the chance of a material breach this year. It's
calibrated on movies. Superforecasters start from the base rate, look for what
makes you different, pick the reference class, and adjust from there.
How the Method Fits Together
Four blocks, in order.
Teach
Four techniques, one first principle
Why heat maps fail, then the first principle: reduce the probability of a material
cyber event. Bayes worked live, then on the billiards table. Fermi, one guessable
part at a time. Superforecasting in three steps.
Model
The register drives the curve
First the inside-out method: a three-question screen. Unique to you? Whole sector,
or a subset? Are your defenses better or worse than the industry standard? One hard
rule: sector-wide conditions get no adjustment. Then what a loss exceedance curve is
and how the Monte Carlo behind it runs (a spreadsheet living ten thousand possible
years and counting the bad ones). And the irreducible floor. However much you spend,
the chance of an event never reaches zero.
Present
Bayside Health Partners briefs the board
One page of facts about a fictional health system. The three-question screen run
alone, then in pairs, then as a team. A curve built in the web tool
(learnfirstprinciples.com/lec). One slide, presented to us. We play the board, and
we ask what the money buys.
Bend
Bend the curve, measure the bend
Once every team owns a curve, we show what moves it and how to measure the move.
Then the wrap: the first thing you'll do at your desk on Monday.
The Capstone: Bayside Health Partners
Read the one-page brief. Every fact you need is on it.
PDF, one page
The Bayside Brief
The handout your team reads first. About a dozen decision-relevant facts and
nothing else. Every number the board will ask about is on it.
In the story, the board meets in 45 minutes and wants two answers: whether to accept a
cyber insurance renewal that came in 40% higher, and whether to fund the security team's
$1.2M improvement request. The materiality line is $2.5M. Your team is Bayside's
security leadership.
What your team walks out with
A loss exceedance curve for Bayside, built in the web tool
(learnfirstprinciples.com/lec).
Three numbers: the combined annual probability of a loss event, the chance of a loss
above the $2.5M line, and the expected annual loss.
Your adjustments from the three-question screen, each with the evidence that earned
it. Adjusting for a sector-wide condition costs you in front of the board.
One slide and an ask. A short presentation, then board questions on the insurance
renewal and on what the $1.2M buys first.
The Tools
Six tools, free, in your browser, no login. Calibration is the warm-up, so run it first.
The other five sit in the order the workshop teaches them.
Calibration • Foundational
Calibration
When you say you're 90% sure, are you right nine times in ten? Give a 90% range
for a handful of questions and count how many of them hold the true answer.
Probably fewer than you'd like. Every range you feed a forecast is only as honest
as this score, which is why the warm-up comes first.
Bayes • Foundational
Bayes on a Billiards Table
A white cue ball sits somewhere on the table and you can't see it. Click where you
think it is. Then roll more balls: orange ones land to its left, blue ones to its
right. Each one nudges your guess.
A few rounds of that and you'll have the reflex. Then point it at a threat-intel
alert and ask the real question: given this alert, how much more likely is it that
you're compromised?
Fermi • Application
Fermi Estimates
How many piano tuners work in Chicago? You've never counted. The estimate comes
from four numbers you can guess at, the number of households, pianos per
household, tunings per year, and tunings one tuner gets through in a year,
multiplied together.
Same move on the cyber question: what does ransomware recovery cost a 5-hospital
system in a year? Break the unknown into parts you can bound, and land within an
order of magnitude or two.
Forecasting • Application
Applied Forecasting
What's the chance of a material breach in the next twelve months? Your gut says
30%. Write that down.
The tool walks you through the same three steps the room does, one screen at a
time, and at the end it sets the number you finished with next to the 30% you
wrote down. It doesn't say which one to trust.
Loss Exceedance Curve • Integration
Loss Exceedance Curve
Everything above feeds this. Six inputs: an outside-in probability, an inside-out
reduction, a low and a high loss bound, a materiality threshold, and how many
simulations to run.
The tool runs the
Monte Carlo simulationRunning thousands of random scenarios to estimate a distribution., draws your
Loss Exceedance CurveA curve that shows the chance losses exceed a given dollar amount., and reads off three numbers: the annual probability of a loss event, the chance
of a loss above the figure your board set, and the expected annual loss.
Bend the Curve • Integration
Bend the Curve
Your curve says what your risk looks like. It does not say what to do about it.
Toggle six controls on and off, put your own annual cost against each one, and
watch the curve move.
Underneath it sits a
floorThe annual chance of a loss event that spending cannot remove.
your spending never removes. What is left between the two is the risk you can
still address, and the tool ranks which control buys the most of it per dollar.
Your Instructors
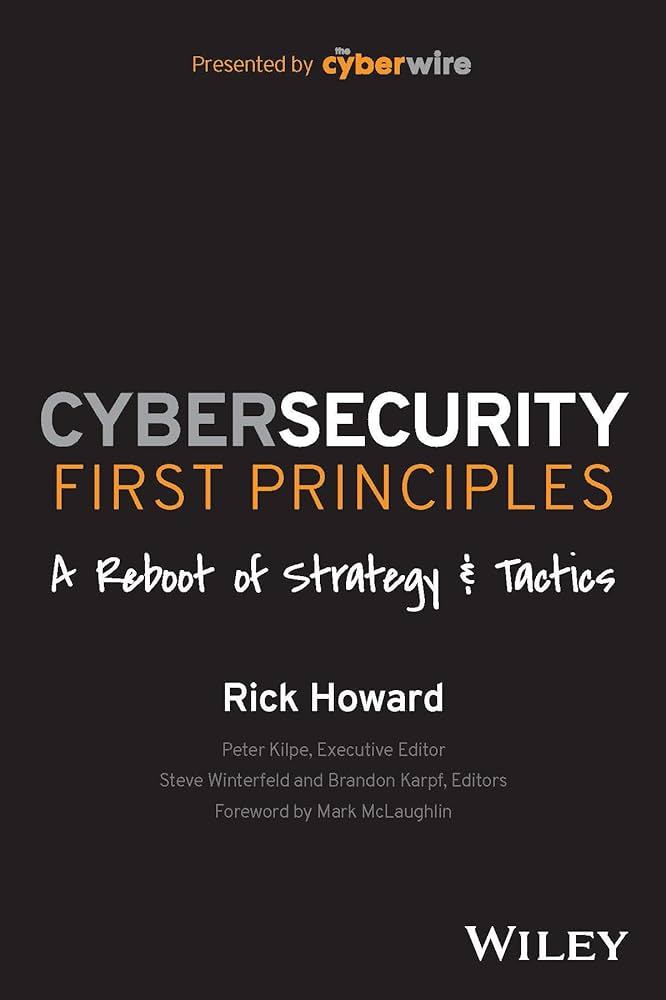
Rick wrote Cybersecurity First Principles. Brandon edited it. This workshop is
the part the book couldn't do on paper.
Brandon Karpf
Leader, International Security Partnerships, NTT
Brandon has spent his career in rooms where the engineer and the executive needed
the same thing said twice. At NTT he leads international security partnerships for
a Fortune 100 company with operations in more than 80 countries, which puts him
most days between a government agency and a global CISO organization, translating.
Before that: seven years as a Cryptologic Warfare Officer in the US Navy, with
time at the National Security Agency, US Cyber Command, and aboard USS Boxer, then
Vice President at N2K Networks and Executive Editor of N2K CyberWire, then
cofounder of a defense tech startup.
Away from NTT he is a Venture Partner at Fulcrum Venture Group, and he edited
Cybersecurity First Principles: A Reboot of Strategy and Tactics (Wiley,
2023).
Rick is the CEO and co-founder of the Cybercanon Project, an all-volunteer
nonprofit curating timeless cybersecurity wisdom. Over 30 years, he has led
security teams across government, industry, and media, including CSO at The
CyberWire and Palo Alto Networks, CISO at TASC, General Manager of iDefense at
VeriSign, Global SOC Director at Counterpane, and Chief of the U.S. Army's
Computer Emergency Response Team.
He teaches because he has seen which security programs hold up under pressure. He
advises Tidal Cyber, the Center for Internet Security, and Resilience, teaches in
Carnegie Mellon's CISO Executive Program, and has authored one book while serving
as executive editor on two others.
The same model as the web tool. Change the inputs, rerun the simulation, read
the curve. The Decision Support sheet computes the three numbers so you can
paste them straight into the slide. The Bend the Curve sheet runs the same six
controls as the web tool.
Eight operational use cases for a loss exceedance curve, each with the modeling
steps, how to present it, and the sentences to say to the people who hold the
budget.
Field notes from a security program that runs on quantified risk. One company's
baseline, the monthly cadence that keeps it current, and three decisions it
drove: ranking security spend, sizing insurance, and pricing revenue at risk.
The first principle the workshop is built on, reduce the probability of a
material cyber event, and the strategies that follow from it. The workshop is
the lab section for this book.
FAIR, the framework for pulling cyber risk apart into frequency and magnitude.
If your organization already speaks FAIR, the curve you build here will look
familiar.
From Heatmaps to Histograms: A Practical Guide to Cyber Risk Quantification
Tony Martin-Vegue
A practical guide to cyber risk quantification, from the heat map you have to
the histogram you need.